Terminal diagnostics
Audience. Daily user — anyone whose terminal tabs feel slow, or whose tabs keep dying.
When to read this. The UI stutters, a tab disappeared without you closing it, or you want to know which tab is eating the machine before it takes the app down with it.
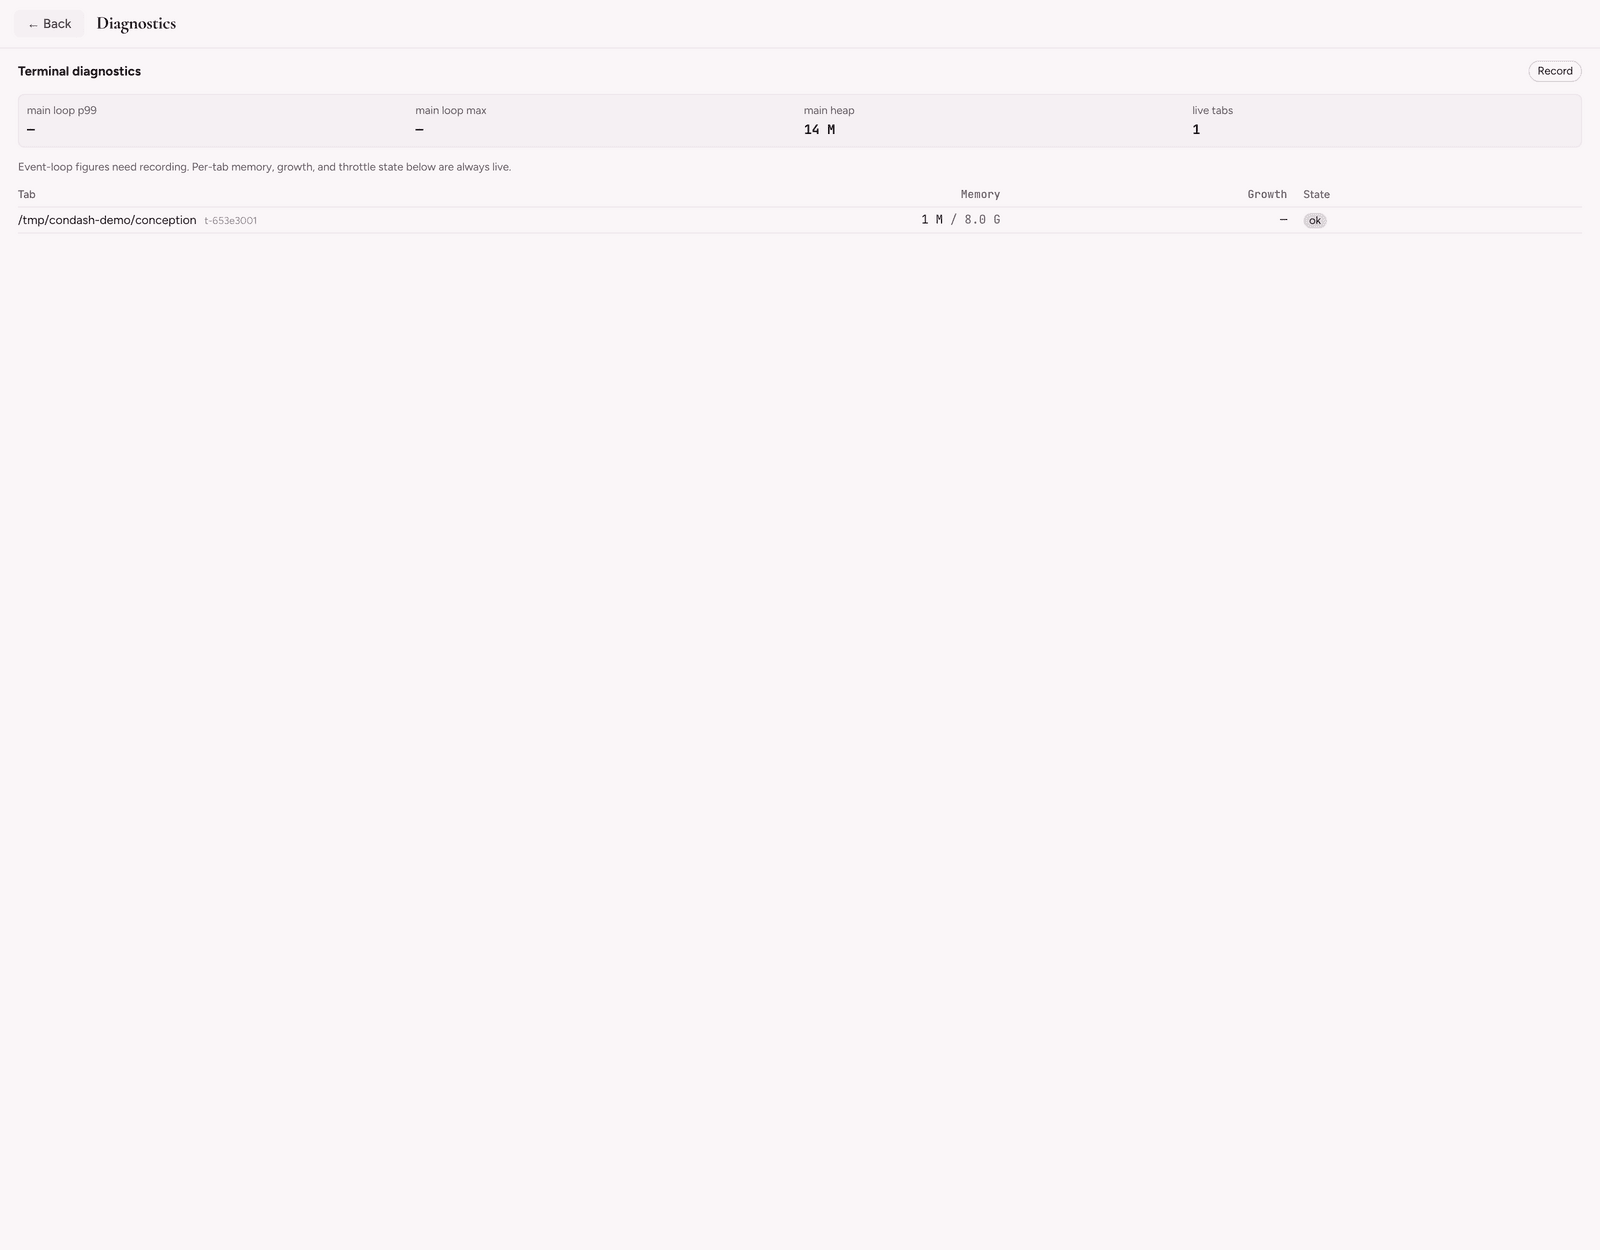
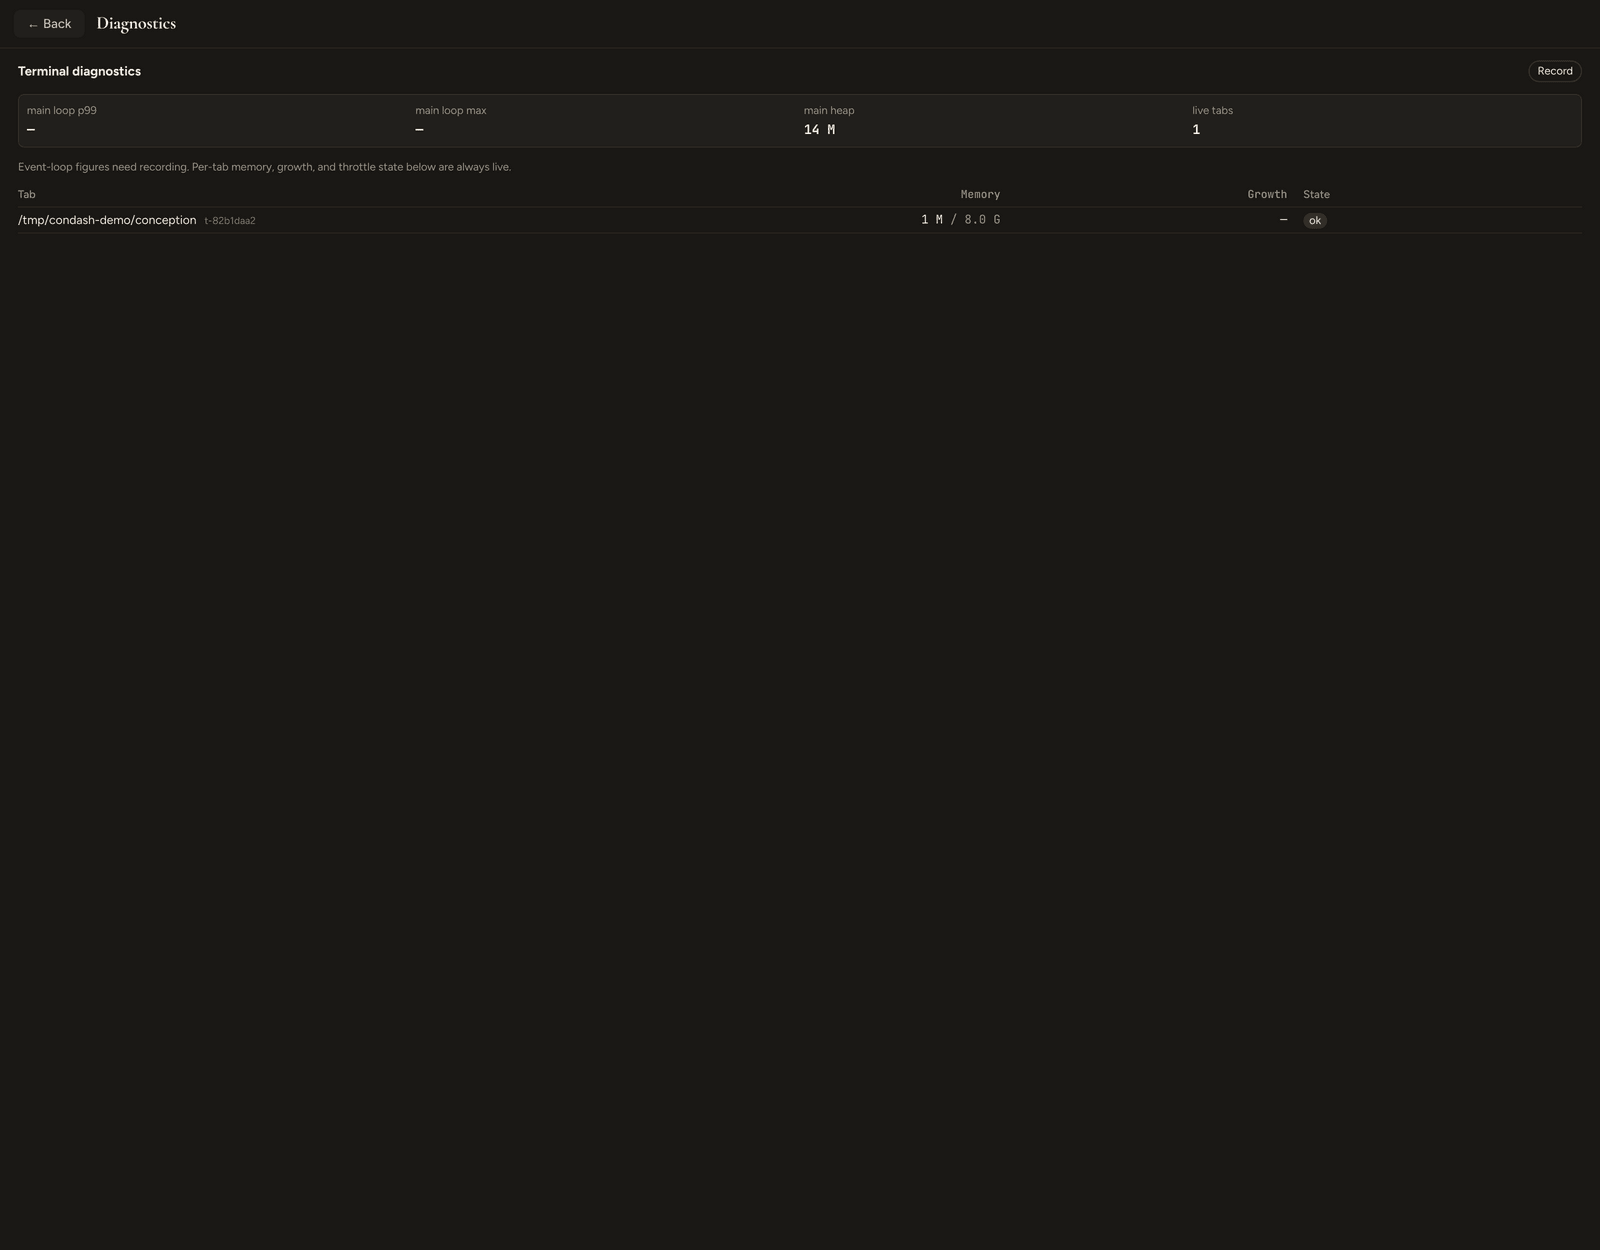
Current route. Click Diagnostics beside Settings in the top bar. Terminal diagnostics opens as a full-window overlay, with no rail item or native View command. The interactive Terminal and Dashboard remain in the bottom band. Storage and the sampler are unchanged.
Back or Esc closes the overlay and restores launcher focus. Vitals poll only while it is open; closing does not stop recording, dispose terminal tabs, or change persisted terminal visibility/height. Record changes the same immediate recorder preference exposed in Settings.
What it answers
The tab strip already shows a memory level. A level is not enough: a tab that climbs from 2 G to 8 G inside one sampling window dies with no warning, and a tab being reclaimed against by the kernel just feels slow with nothing to attribute it to. This pane adds the two missing readings — growth rate and throttle state — and puts the main process's own health next to them.
The vitals strip
Four figures across the top, re-read every 2.5 seconds:
| Figure | Meaning |
|---|---|
| main loop p99 | 99th-percentile event-loop delay in the main process. The most direct measure of UI stalls — main is a single thread shared by every tab plus git status, file watching, and all IPC. |
| main loop max | Worst single delay observed. |
| main heap | Main-process heap in use. |
| live tabs | Terminal sessions currently running (exited tabs are excluded from the whole pane). |
The two event-loop figures need recording on; per-tab memory, growth, and throttle state below them come from the always-on memory sampler and are live regardless. When recording is off the pane says so in a hint line rather than showing empty cells.
The per-tab table
One row per live tab:
| Column | What it shows |
|---|---|
| Tab | The repo or cwd the tab is in, with its session id alongside — two tabs opened in one directory would otherwise render as a duplicated row. |
| Memory | Current usage, and the tab's cap after a / when one is set (5.8 G / 8 G). |
| Growth | Signed rate in MB/s. A rate under 1 MB/s renders as — rather than a noisy ±1, so a resting tab doesn't shout. |
| State | ok, a time-to-cap warning, or throttled. |
The state cell is the one to read.
throttled— the kernel is actively reclaiming memory against this tab at itsMemoryHighwatermark. This is the state tabs die in under system memory pressure; it is the earliest actionable signal you get.≈40s to cap/≈3m to cap— the tab is growing and, at its current rate, will hit its own cap in that long. Only shown when the projection lands within ten minutes, so a slow-growing tab never cries wolf.ok— not throttled, not projected to hit a cap.
The caps and watermarks themselves are terminal.memory.max / terminal.memory.high — see Config files → Terminal memory. Raising max helps a tab that hit its own cap; it does not help a tab killed under system pressure, which never reached its cap. Troubleshooting → A terminal tab disappeared walks the verdicts.
Recording
The button in the pane header toggles terminal.perf.enabled — a personal setting in the per-machine settings.json, off by default. It reads:
- Record — off. Press to start.
- Recording — on, and writes are landing.
- Write failed — on, but the write to
.condash/perf/is failing. The label deliberately never says "Recording" in this state: believing you captured a long run and coming back to nothing is worse than knowing immediately. Toggle off and on to retry.
Records land in <conception>/.condash/perf/YYYY-MM-DD.jsonl, one file per day. A janitor keeps 14 days and caps the whole directory at 200 MB, evicting oldest-first; today's file is never a victim, so a live recording is never pulled out from under you. Recording costs roughly 10 MB/day with two active tabs and ~80 MB/day with twenty.
The record schema — every counter, every field, and how to read it — is dissected in Internals → Terminal performance recording.
A working method
- Reproduce the slowness with the pane open. If main loop p99 is high, the stall is in the main process; if it is flat while a tab shows a big Growth, the problem is that tab's own workload.
- Watch State. A tab that sits at
throttledfor minutes is the one to kill or restart — it is on the path to being killed for you. - If disk logging is on (
terminal.logging.enabled), turn it off and re-measure: the main process runs a second full ANSI parse of every byte when it is on, and that A/B is usually decisive. - If you need evidence to attach to an issue, press Record, reproduce, stop, and attach the day's
.jsonl.
See also
- Troubleshooting — the symptom-first version of this page, including the death verdicts.
- The embedded terminal — where the tabs being measured come from.
- Config files → Terminal perf — the
terminal.perfkey, the recording toggles, and the retention caps; the record schema is dissected in Internals → Terminal performance recording.